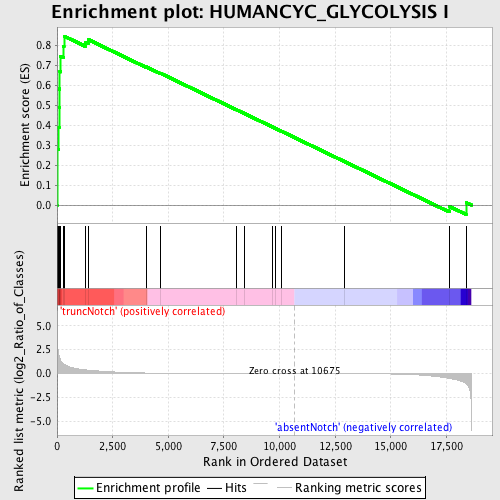
Profile of the Running ES Score & Positions of GeneSet Members on the Rank Ordered List
| Dataset | Set_03_absentNotch_versus_truncNotch.phenotype_absentNotch_versus_truncNotch.cls #truncNotch_versus_absentNotch |
| Phenotype | phenotype_absentNotch_versus_truncNotch.cls#truncNotch_versus_absentNotch |
| Upregulated in class | truncNotch |
| GeneSet | HUMANCYC_GLYCOLYSIS I |
| Enrichment Score (ES) | 0.847859 |
| Normalized Enrichment Score (NES) | 1.6107095 |
| Nominal p-value | 0.0058027077 |
| FDR q-value | 0.24608257 |
| FWER p-Value | 0.616 |
| PROBE | DESCRIPTION (from dataset) | GENE SYMBOL | GENE_TITLE | RANK IN GENE LIST | RANK METRIC SCORE | RUNNING ES | CORE ENRICHMENT | |
|---|---|---|---|---|---|---|---|---|
| 1 | PGK1 | 1570494 630300 | 6 | 5.004 | 0.2801 | Yes | ||
| 2 | TPI1 | 1500215 2100154 | 70 | 2.022 | 0.3901 | Yes | ||
| 3 | PGAM2 | 3610605 | 92 | 1.782 | 0.4888 | Yes | ||
| 4 | FBP1 | 1470762 | 102 | 1.688 | 0.5829 | Yes | ||
| 5 | ENO1 | 5340128 | 122 | 1.566 | 0.6697 | Yes | ||
| 6 | ENO3 | 5270136 | 158 | 1.372 | 0.7447 | Yes | ||
| 7 | PFKP | 70138 6760040 1170278 | 282 | 1.022 | 0.7954 | Yes | ||
| 8 | ALDOA | 6290672 | 312 | 0.964 | 0.8479 | Yes | ||
| 9 | PGAM1 | 2570133 | 1266 | 0.383 | 0.8181 | No | ||
| 10 | PFKL | 6200167 | 1398 | 0.351 | 0.8307 | No | ||
| 11 | GAPDHS | 2690463 | 4008 | 0.056 | 0.6936 | No | ||
| 12 | FBP2 | 1580193 | 4630 | 0.039 | 0.6623 | No | ||
| 13 | ALDOC | 450121 610427 | 8041 | 0.007 | 0.4794 | No | ||
| 14 | PGK2 | 2650091 | 8409 | 0.006 | 0.4600 | No | ||
| 15 | BPGM | 5080520 | 9659 | 0.003 | 0.3930 | No | ||
| 16 | ENO2 | 2320068 | 9801 | 0.002 | 0.3855 | No | ||
| 17 | ALDOB | 4730324 | 10064 | 0.001 | 0.3715 | No | ||
| 18 | PKLR | 1170400 2470114 | 12939 | -0.007 | 0.2174 | No | ||
| 19 | PFKM | 1990156 5720168 | 17625 | -0.504 | -0.0063 | No | ||
| 20 | PKM2 | 6520403 70500 | 18387 | -1.062 | 0.0123 | No |

